

Is Life Really 8-10 Times Harder Than the 1980s?
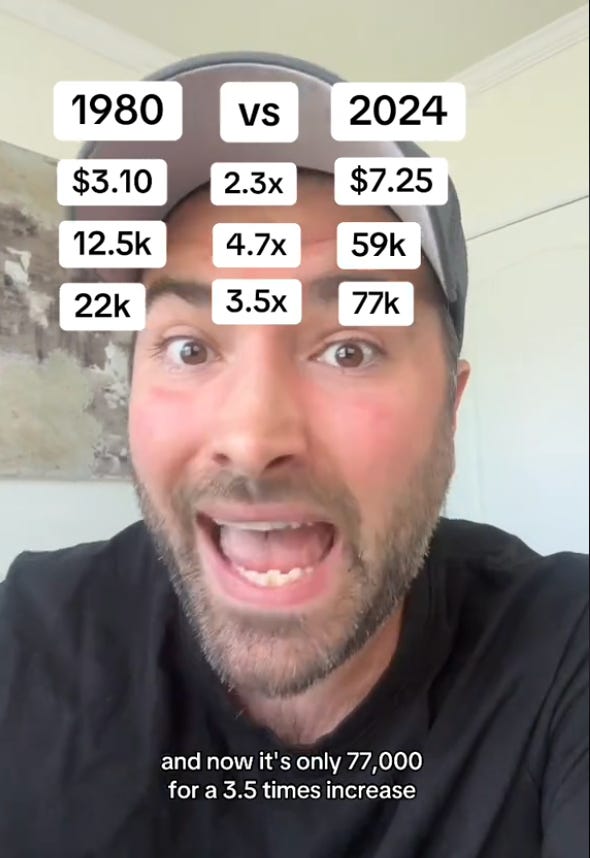
A new viral video claims that life is 8 to 10 times harder today than it was in the 1980s. With over 28 million views on TikTok, it's no wonder this topic has caught everyone's attention.

Thank you for reading Monday Morning Economist! This is a free weekly newsletter that explores the economics behind pop culture and current events. This newsletter lands in the inbox of more than 4,600 subscribers every week! You can support this newsletter by sharing this free post or becoming a paid supporter:

In the era of viral videos and social media sensationalism, it’s easy for misinformation to spread quickly. One of the most recent videos making its way around TikTok claims that life is 8 to 10 times harder today (financially) than it was in the 1980s. The minute-long video has already amassed over 28 million views on TikTok and close to another million on YouTube.
But how has living gotten so much worse for today’s generation of young adults? Freddie Smith argues that increased housing costs (both renting and buying) and college tuition have increased faster than incomes; the result is a bleak picture for younger generations. If we look closer at his data, we find many of his claims to be misleading or outright incorrect. Let’s look at what he has to say and then provide a clearer, more accurate understanding of the economic realities for young Americans.
The Viral Video's Origin Story
Why make the video at all? The financial influencer was responding to a Whoopi Goldberg rant from The View that aired in November 2023. In her segment, Whoopi argued that every generation felt like things were tougher for them when they were younger compared to the generation before them, and that this wasn’t a new feeling. Freddie had posted a video about this when it first came out, but decided to weigh in again and argue that Goldberg was wrong on the notion that every generation feels they have it tougher than the generations before them.
You can watch the entire segment below, but the part that Smith clipped for his video starts around the 2:20 mark:
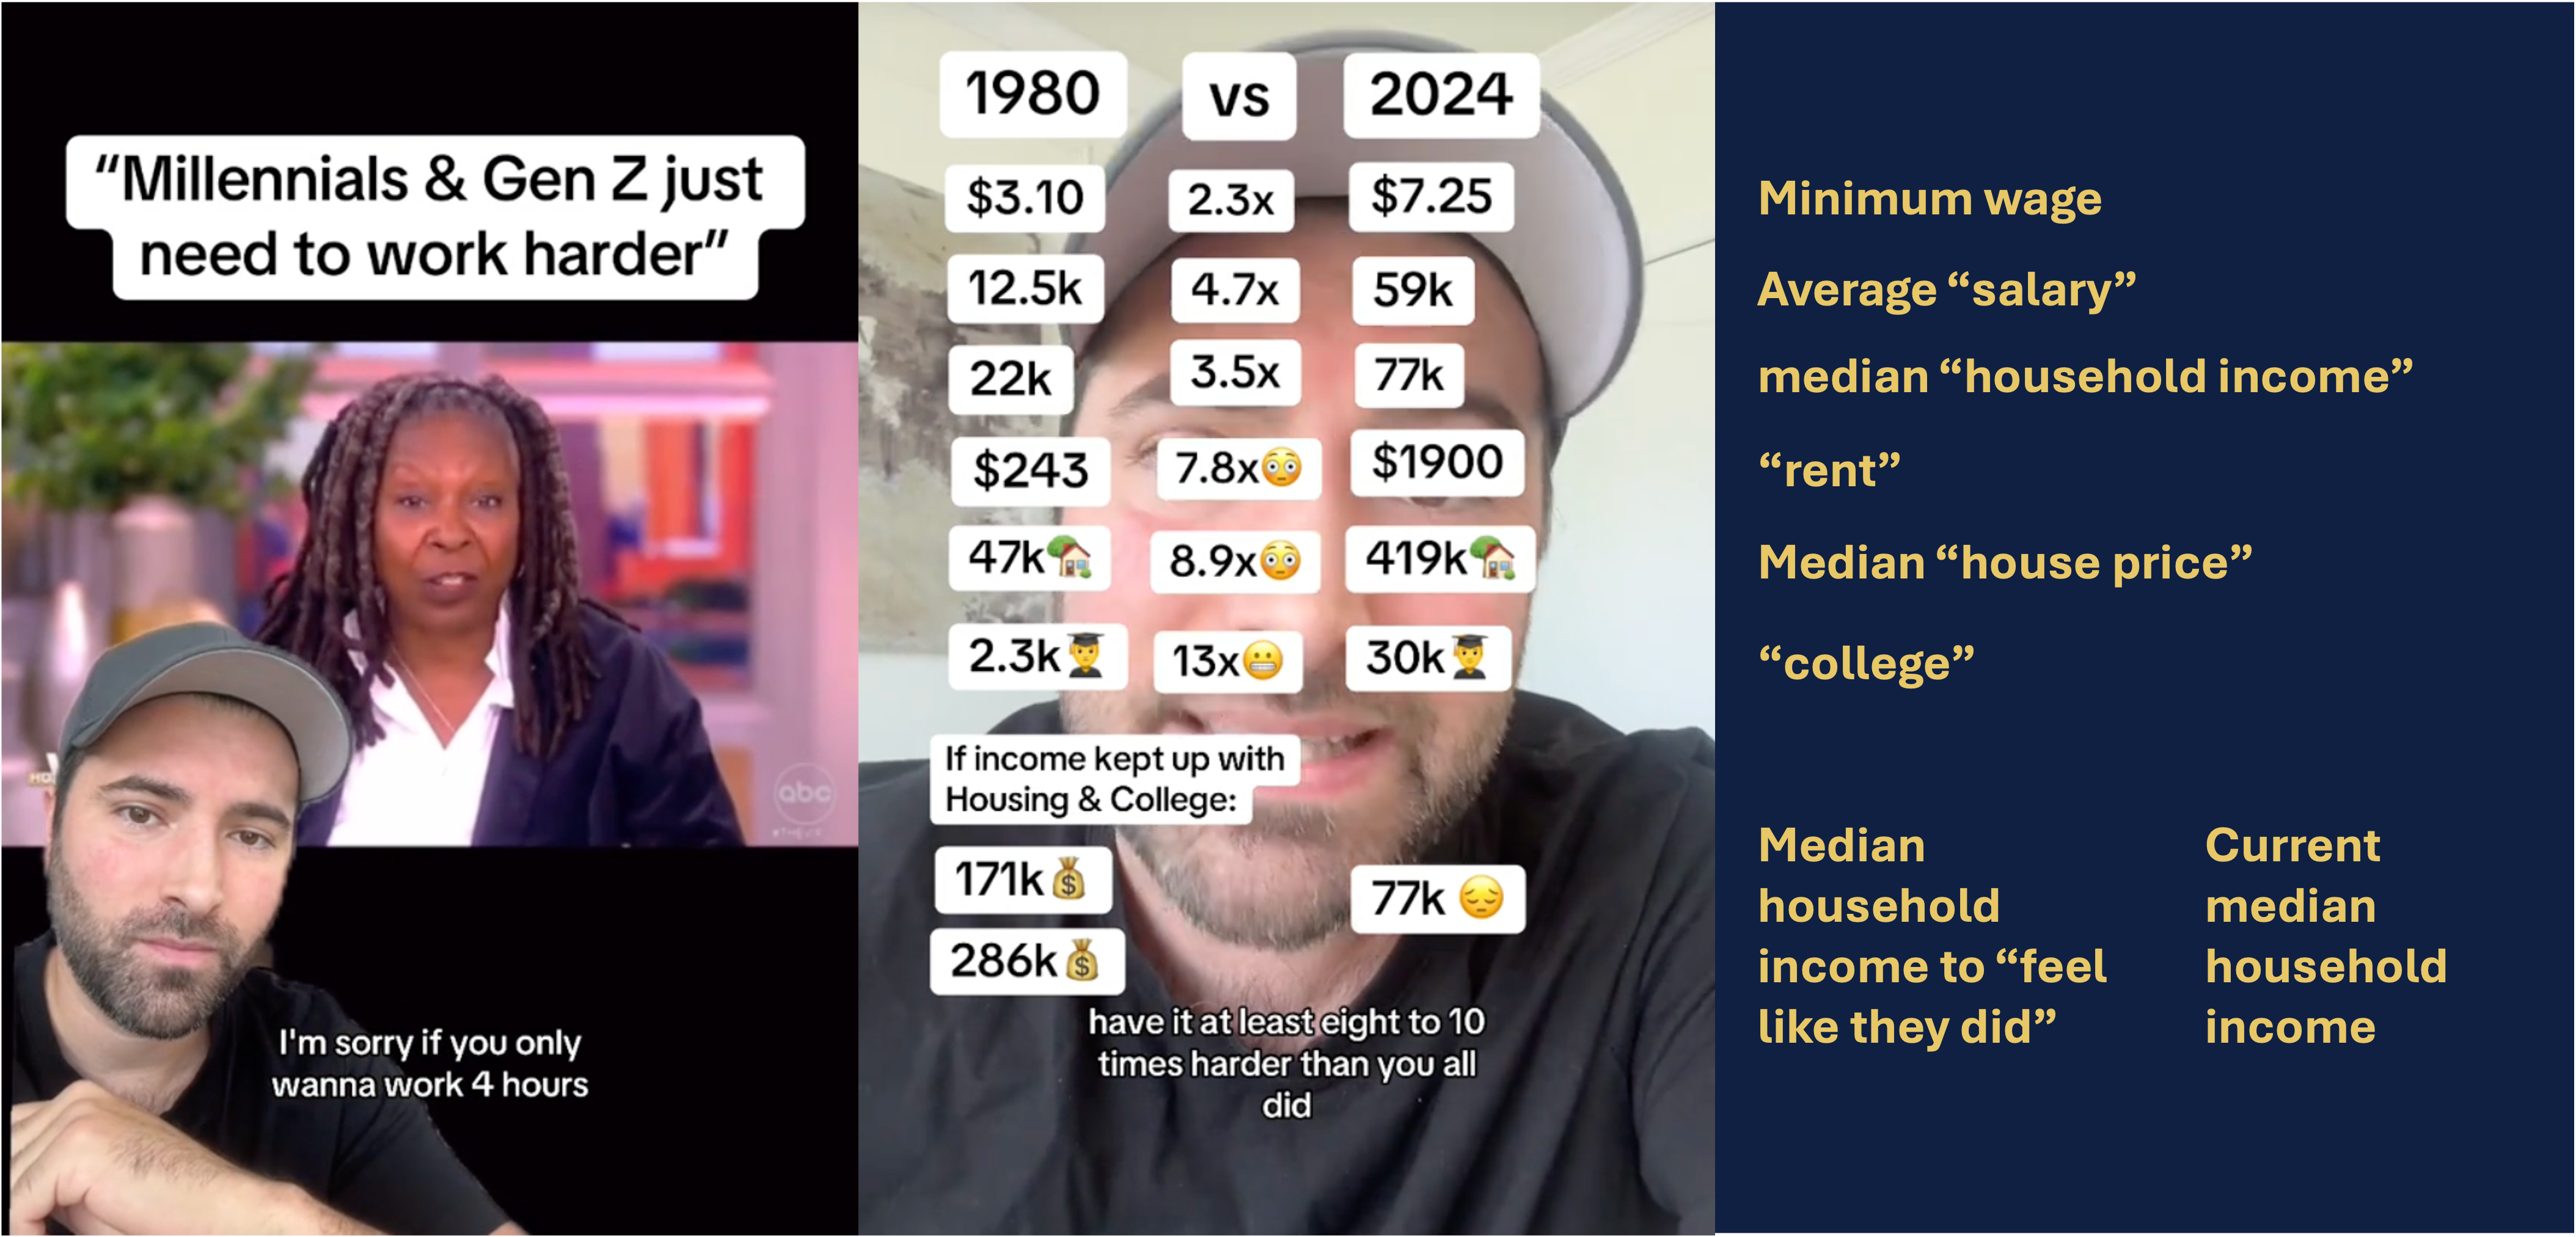
In Smith’s video, he would go on to provide a series of data points that he believes support his argument that current generations have it 8-10 times harder than Goldberg’s generation. Smith specializes in these sorts of “hot takes” that use data to highlight the economic problems facing millennials and younger adults. The problem? He’s often hyperbolic in his claims, leaves out relevant information, or simply mixes data sources to support his claims.
Earlier this year, I joined forces with Dr. Abdullah Al Bahrani and Chris Clarke to debunk Smith’s claims that America was living in a “Silent Depression.” Despite the many people who debunk his claims, Smith has still amassed a significant following online. This isn’t just because of his engaging delivery, but because his message resonates with many people who feel economically strained and frustrated. His narrative strikes a chord with young adults who struggle to get ahead and find his explanations compelling. I’m sympathetic to those concerns and agree that we need better policies to support those in need, it’s important to address Smith’s hyperbolic claims with accurate information. Let’s get started!
Misleading Measures of Income
Smith kicks off his response to Goldberg by highlighting how wages, earnings, and income have changed. Those are all technically different measures, but people often use them interchangeably. While it’s true that the federal minimum wage hasn’t changed since 2009, 34 states have minimum wages that exceed the federal rate, including large states like California, New York, and Illinois.
Smith’s mainly focuses on income differences between 1980 and 2024 by looking at what he claims to be median household income. That is not an uncommon measure for comparing a family's well-being, but it turns out there’s a slight problem in the numbers he discusses in his video. He’s actually mixing two different measures: he reports median family income for 1980 and median household income for 2024. While they may sound similar, those two measures are not the same.
In 1980, the median family income was $21,020, but Smith rounds this up to $22,000 to make his argument look better. We don’t have data on 2024 income yet since the year isn’t over. He doesn’t cite his 2024 source, but I’m guessing he used the first result he found on a Google search which comes from a financial investment blog making some dubious assumptions on income. The most reliable data we have on income come from the 2022 Census, which reports a median family income of $92,750. Instead of income growing by 3.5 times as Smith claims, median family incomes have actually increased 4.4 times!
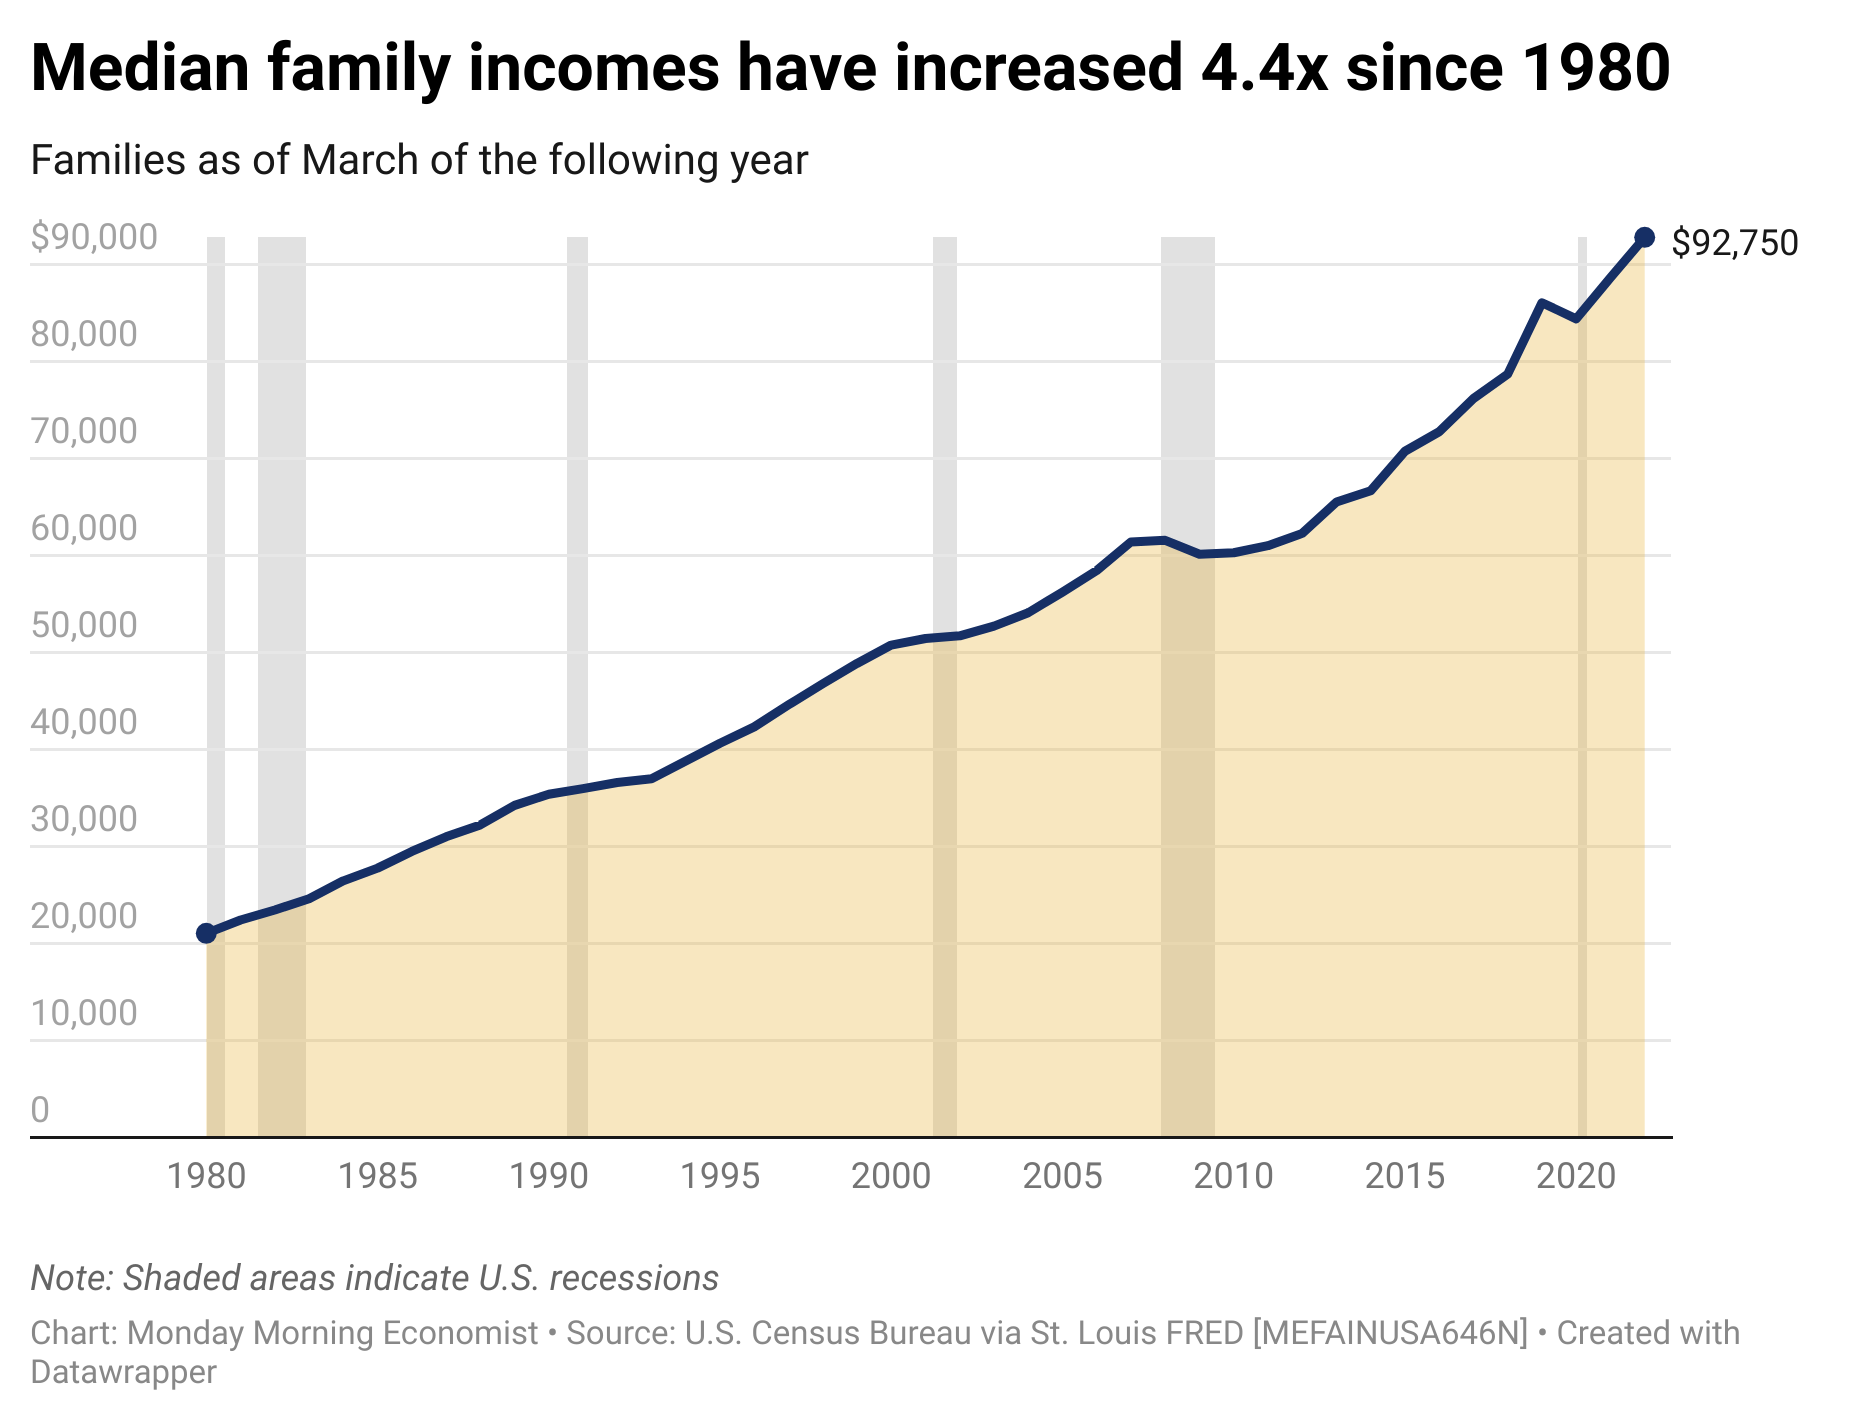
By conflating median family income with median household income and rounding figures to suit his narrative, Smith distorts how much incomes have actually grown. Families today generally have higher incomes, partly due to the increased prevalence of dual-income families and higher educational attainment.
Even if we were to just look at changes in income based on inflation, American families are doing much better. Adjusting for inflation, $21,020 in 1980 is equivalent to roughly $74,648 in 2022. This means that, in real terms, median family income has increased significantly more than the general price level, rather than stagnating as Smith suggests.
What About Rental Prices?
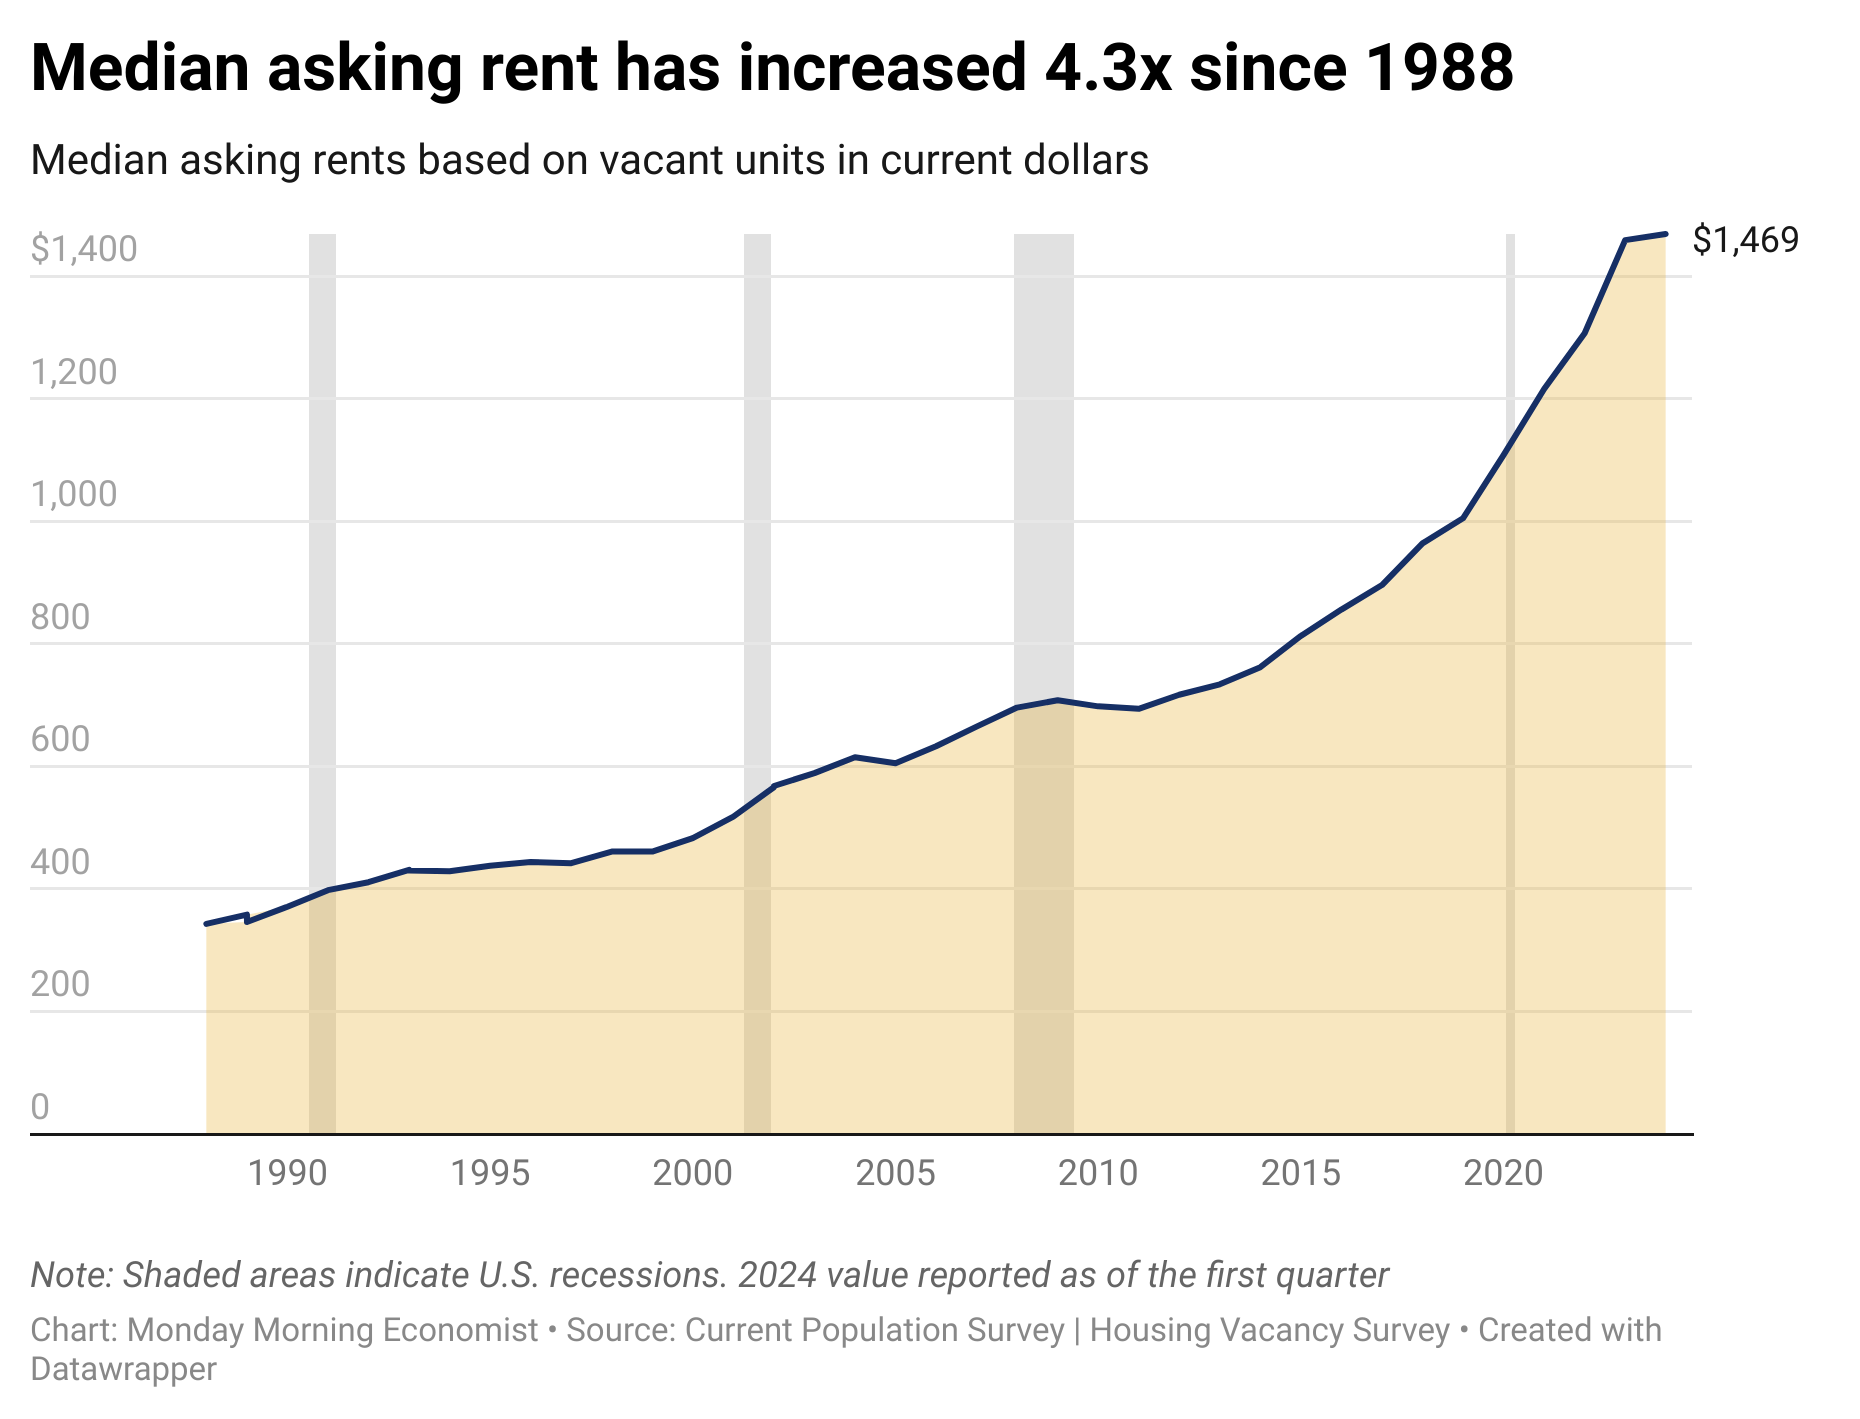
Smith’s main argument is that family income hasn’t kept up with the cost of housing and college. Smith claims that the median rent has skyrocketed from $243 in 1980 to $1,900 in 2024. He doesn’t cite any sources in these values, but the 1980 value matches the median gross rent as reported by the U.S. Census. Like before, I’m guessing he pulled his 2024 value from the first Google hit he found. I found the same number on a World Population Review post, which linked to Zillow.
The latest available data from the Census shows the median asking rent for vacant rental units $1,469 for the first quarter of 2024, not $1,900 as Smith claims. If we wanted to stay consistent with our family income levels from before, the Census found the median rent in 2022 was $1,300. Again, while there has been a significant increase in rental prices in the past 40 years, the actual jump (6.0 times) is not as dramatic as Smith portrays (7.8 times). It’s hard to understate the impact of the housing crisis, but several factors, including urbanization, supply constraints, and improved housing quality, contribute to higher rents.
What About Buying a Home?
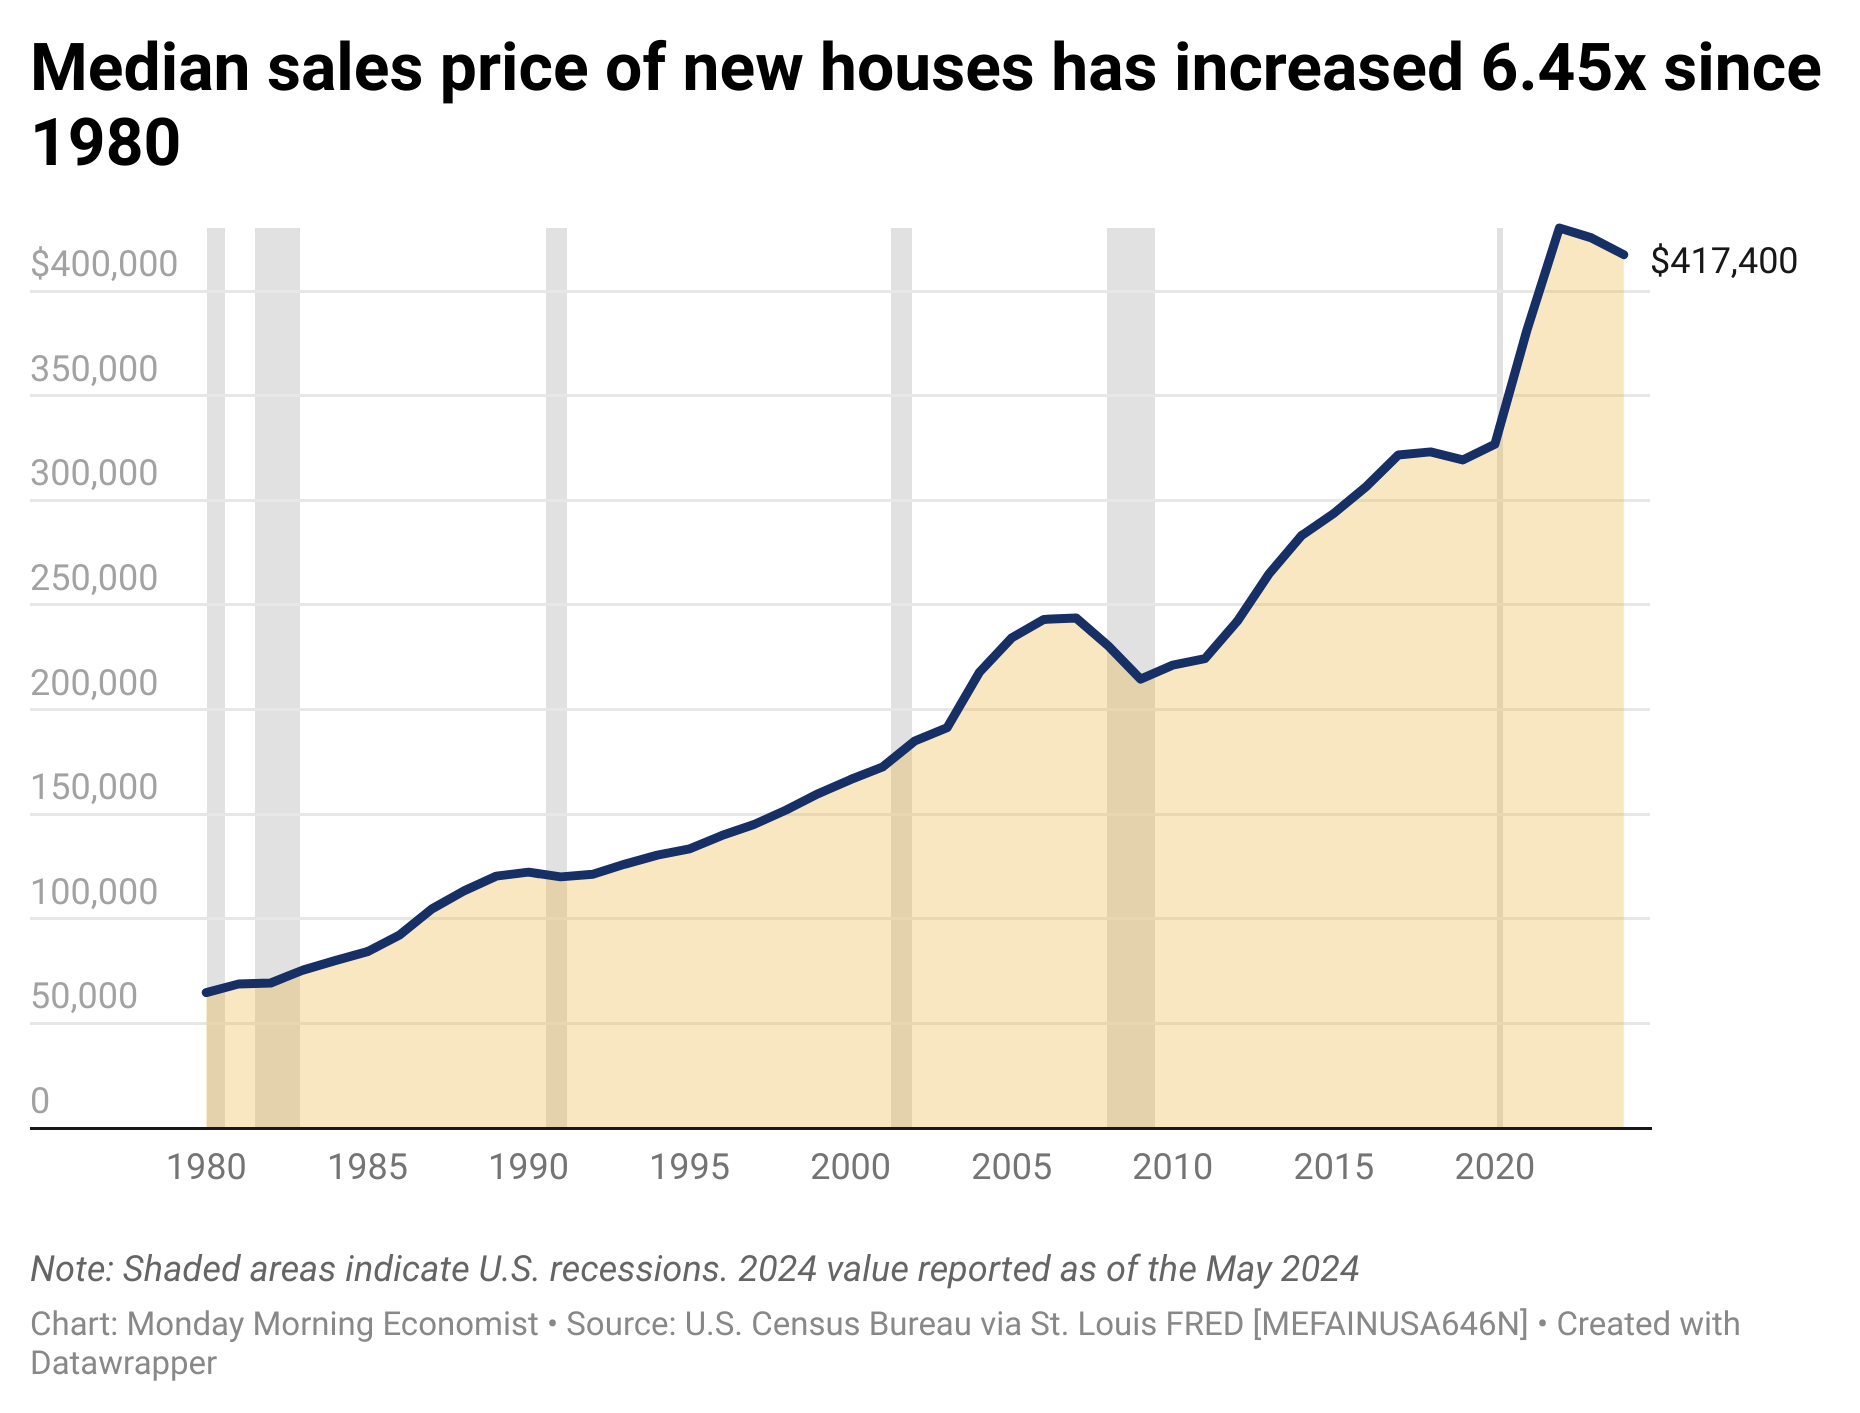
Next, Smith looks at median home prices, stating that the median home price in 1980 was $47,000. That value likely comes from the Census’s measure of median home values, which looks at owner-occupied single-family housing units on less than 10 acres without a business or medical office on the property. It’s essentially measuring the value of all homes in the United States at that point in time.
Compare that measure with what Smith reports for the 2024 value: $417,400. The problem? He’s reporting the median sales price of new houses sold in May 2024. Again, he’s comparing two different measures to argue his case, but the measures aren’t comparable since one measures the value of all homes in existence (which includes old homes) and the other measures only new homes.
The U.S. Census Bureau and U.S. Department of Housing and Urban Development have a measure of median sales prices of houses sold in the United States going back to 1963. If we use the same measure to compare across time, the median sales price of a new home in 1980 was $64,750. Just like with the rental measures, there has been a substantial increase in new home prices (6.5 times), but it is far from the 8.9 times increase Smith implies.
Let's also consider the context behind the numbers Smith uses in his videos. The 2024 value he cites is based on the prices of new single-family houses. American homes have changed a lot in the past 40 years, notably getting larger with equipment and amenities. Bigger homes with nicer things are going to cost more, but people looking to buy a home aren’t forced to purchase new construction. Plenty of older homes are also sold each year to first time home buyers.
The Census also tracks the median asking sales price for vacant homes, which includes both new and old properties. In the first quarter of 2024, the median asking price for these vacant homes was $334,800. This paints a very different picture from Smith’s claim. The dynamics of the housing market—like supply and demand imbalances, zoning ordinances, lower interest rates, and increased construction costs—all play important roles in who prices have changed over the past few decades.
Context Matters
Smith’s overall argument hinges on the assertion that economic conditions have become 8 to 10 times harder, which is why younger generations are frustrated with the current economic environment. Even if we used his incorrect numbers, the increase in expenses would be around 2.2 times more, not the hyperbolic figures he suggests. When we correct his mistakes and use comparable measures, the increase is about 1.37 times.
But this is where context matters. Freddie Smith cherry-picks his data points to tell his stories. He regularly focuses on categories like housing and the cost of college costs (which are also wrong, by the way), both of which have seen significant increases in the past 40 years. He picks these two and leaves you to assume everything else has gotten just as expensive, but he ignores all the other spending categories that have become relatively more affordable over time.
Technological advancements and globalization have reduced the costs of many consumer goods. Food and clothing, for instance, have become relatively cheaper and more accessible. The rapid advancement of technology has not only created new industries and job opportunities but also significantly reduced the costs of many goods and services. A couple of years ago, Tim Lee (author of Full Stack Economics) put together a great selection of charts showing how we’re (mostly) living better than our parents did:

Final Thoughts
Freddie Smith relies on sensationalism and selective data to paint a dire picture of today’s economic reality. A lot of the things we buy have become more affordable. There are challenges facing every generation, but the situation is far more nuanced. Income levels have risen a lot since the 1980s, but so has wealth and income inequality. It’s important to have a more balanced perspective that acknowledges both the progress and the ongoing challenges. Unfortunately, accurate data and relevant context isn’t as popular on social media.
We live in a time where misinformation spreads rapidly, but it’s important that we ground our discussions in fact-based analysis rather than rely on whatever the first Google search claims to be true. We need more informed dialogue about the economic realities faced by different generations. Only then can we address the real issues and work towards solutions that ensure a better economic future for all.

There are an estimated 40.9 million people living in poverty in the United States, approximately 12.6% of the population [U.S. Census Bureau]
In 2022, 65.6% of working women worked full-time, year-round, the largest share on record [U.S. Census Bureau]
The median gross rent in the United States in 1940 was $27 [U.S. Census Bureau]
In the first quarter of 2024, less than 1% of homes in the United States were vacant [U.S. Census Bureau]
In 2018, the Black-white home ownership gap reached 30.5 percentage points, its highest level in 50 years [Urban Institute]
"Technological advancements and globalization have reduced the costs of many consumer goods. Food and clothing, for instance, have become relatively cheaper and more accessible. The rapid advancement of technology has not only created new industries and job opportunities but also significantly reduced the costs of many goods and services."
I'm not known in my circles for being an optimist. However, I frequently comment on what a time it is to be alive, how prosperous and comfortable we as a society are. We truly live in a time of (technological) miracles. So the above quoted lines resonated. On that note, some positive economic bits (NB: I don't necessarily agree with all of the authors' opinions, but the overall takeaways are good):
People are spending less of their income on food:
https://cepr.net/in-the-good-old-days-one-fourth-of-income-went-to-food/
The cost of lighting your environment is de minimus:
https://www.statista.com/chart/10567/the-cost-of-light-through-the-ages/
Shown also in two graphs, their metrics being inverses of each other:
https://ourworldindata.org/grapher/the-productivity-of-labour-in-producing-light-lumen-hours-per-hour-of-labour-1800-to-the-present
https://humanprogress.org/dataset/time-worked-at-average-wage-for-one-hour-of-light/
And, of course, my intuitive (and sarcastic) "gee, I wonder why costs of some things are rising so much faster than inflation" response:
https://www.rationalexuberance.org/p/the-chart-of-the-century
although I confess that, according to this chart, housing has risen less (and food more) than I would have expected, which he addresses.
I don't have to read this to see what rubbish is being written here!
My father worked in retail for 36 hours a week and he could pay for everything, there were never any problems
Today my brother and I work in a steel factory and because we live together and pool our money we can't afford what our father could. I don't think your numbers work like that!
The same goes for our step-sister's father. He worked in the same job back then (until now) in the same company in the same building (bakery). He can only afford cheap food. He hasn't been to a restaurant with his wife for years, let alone to the cinema or anything else. He can't afford a new car either. He and his wife are considering moving to the country because they can hardly afford life in the city anymore...
I notice it with my brother too. In the last 10 years alone, we have noticed how we can afford less and less, even though we now earn twice as much as we did at the beginning, there is less and less money left in our pockets at the end of the month and we have had to make huge sacrifices.
Where the hell did you get your numbers from?
Sorry for my bad English I speak German